Weekly Update: Bad Chart Edition
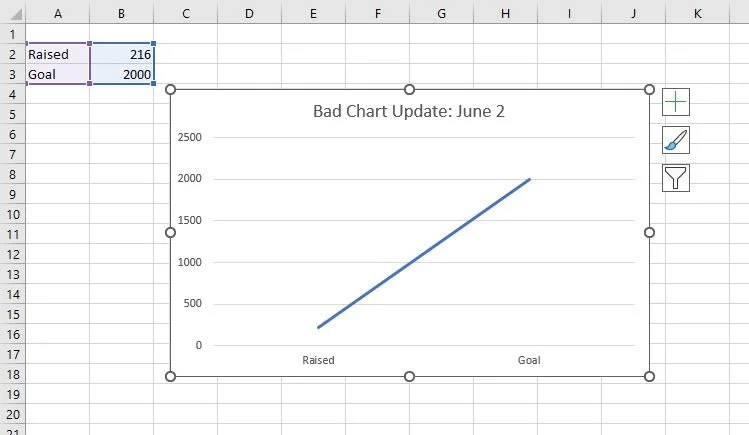
Things are off and rollin’ now. Been a busy week around the ol’ homestead. Got some plants in the ground. Hosted some lovely guests. And the donations are already pourin’ in! In make anyone who appreciates good data visualization made, this weeks theme is: AWFUL CHARTS.
Fundraising Update:
You can’t tell at all from this, but we’re already 10% of the way there!
Yeaaaah buddy! Shout out to the all-stars Hannah, Evan, and Diana for already donating! As always you can donate here:
I was shopping for plants the other day and thought, “Me and this tomato? Not so different.” So to lead you to bad chart #2, here’s what I saw:
And it felt like looking in a mirror. So, (and promise not to read this like I’m doing a 1970’s rap…) without further ado, here’s chart number two! (You for sure did. I shouldn’t have said anything.)
If you liked that chart, consider giving $9.99 today! It’ll go towards something even better than tomatoes: cancer research and patient support!
Training Update:
In terms of actual running, not much doing this week. But that’s also by design (see late season performer). It’s been hot here, and I wanted to go into my training plan with pretty fresh legs. I’d been feeling the half I ran last month and the five straight days of skiing pretty hard the last few weeks so I’ve put myself on garden duty instead. Might go out for an easy run after work today. Might go bike at the Y and read a book for a while. Might do neither, make a mai tai, and get some more gardening done. Whatever I do, it’s fine because the cells in my training spreadsheet don’t have numbers in em yet.


